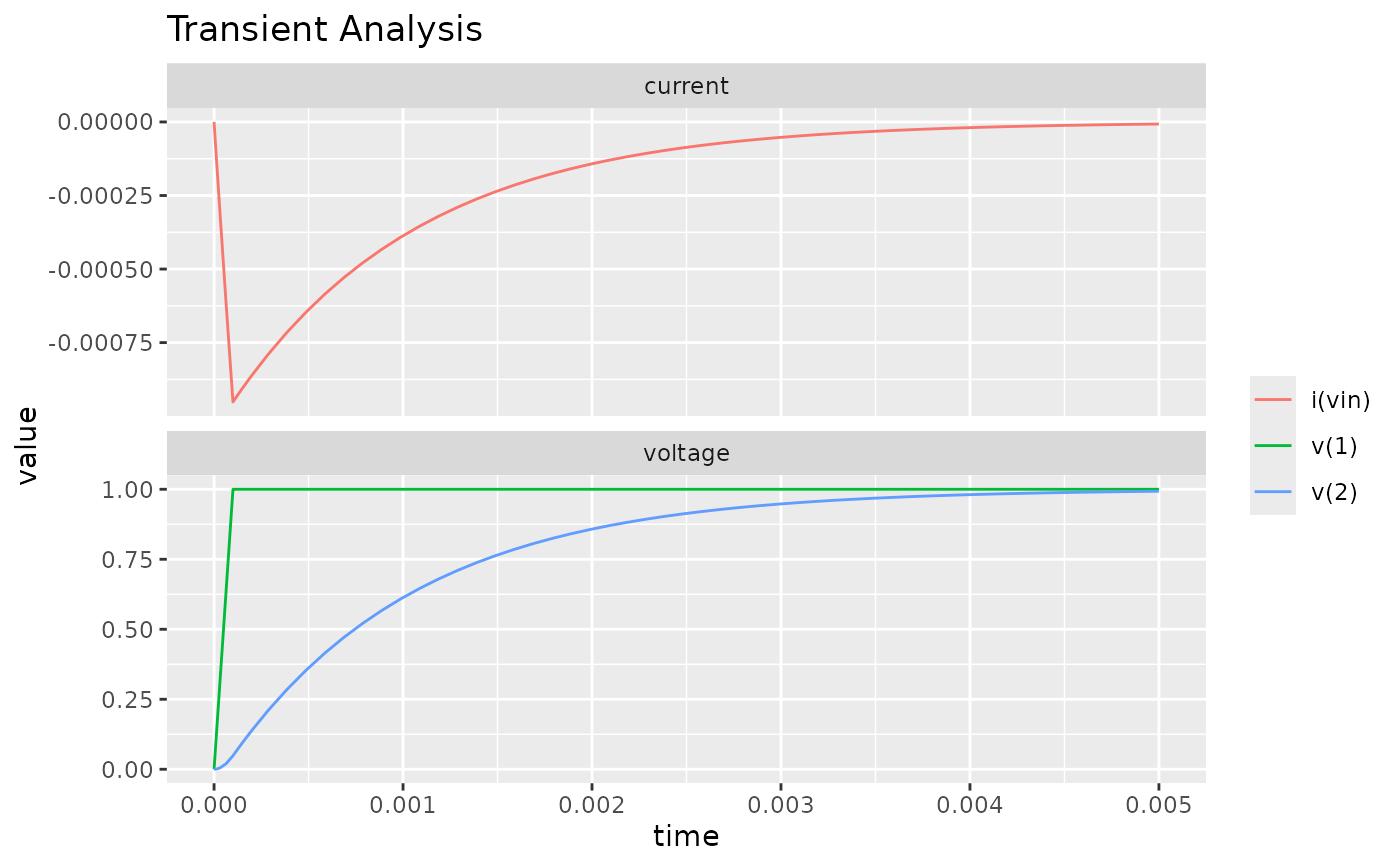
Draws every non-scale variable of a plot against its scale, one
line per variable, faceted by type (voltages and currents get their
own panels). Complex plots show the magnitude in dB. Requires the
ggplot2 package; for anything more specific, start from
tibble::as_tibble() of the plot.
Examples
res <- spice_run("rc\nvin 1 0 pulse(0 1)\nr1 1 2 1k\nc1 2 0 1u\n.tran 0.1m 5m\n.end")
ggplot2::autoplot(spice_plots(res)[[1]])